This is a new method for quickly finding new trends in health, consumer buying, web traffic, fraud & system intrusions, etc.
In today’s modern world, anything that deviates from “the usual” is interesting. Could be an appealing new trend, or could be warning sign. Either way, you want to know about it!
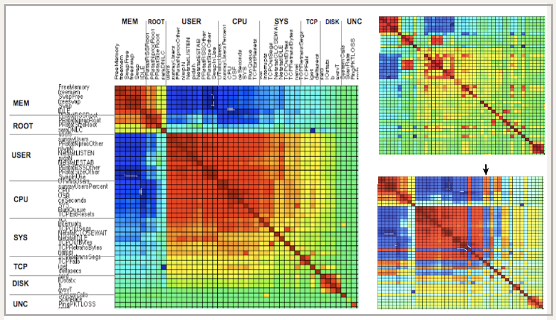
This method uses statistical correlation to create a colored 2D map with distinct patterns that the eye sees immediately.
The “subjects” here were UNIX servers, but the system works on any grouping of individuals — machines or people or weather patterns or websites or whatever! — that can have usual and unusual states that you want to identify.
LEFT – “Usual”
RIGHT – Two cases of “unusual”, the top one missing most of the expected features, and the bottom one showing bands of blue where red should be, and red where blue should be.