Virtual machines are logical entities living inside physical entities. Hosts connect to other hosts & participate in clusters, some of them sharing a physical box but most of them not doing so.
Their connections to one another matter, so how can we show the connections without overwhelming the human brain? I was brought in on a special project to help solve this issue on one VMW product.
Existing visualizations were of two types both confusing to the eye and lacking in any kind of interaction.
The “spider web” view (LEFT) and the “spaghetti” view (RIGHT).


I understood that software engineers have constraints on what they can change late in the product life cycle, so I offered several “solution paths” hoping they would be able to implement at least one.
- Add interaction – E.g., clicking a host highlights its connections & dims the others. LEFT SIDE IMAGE
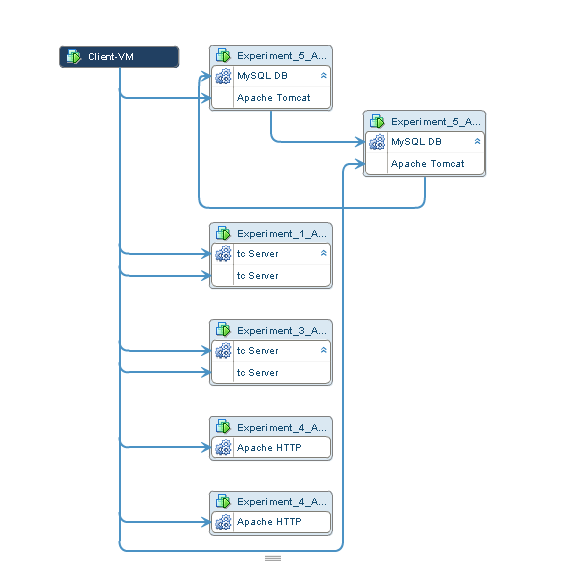
- Limit line orientations to horizontal and vertical – Vision science tells us these are easier for the human eye & brain to follow than randomly tilted lines. RIGHT SIDE IMAGE
- Group the hosts on the page to show connection logic, & draw lines between groups rather than individual objects. RIGHT SIDE IMAGE


USER ACCEPTANCE TESTING with VMware system administrators was done using wire frames like these. Users were unanimous in preferring the RECOMMENDED view.
THE VIEW THAT SHIPPED – Not exactly as recommended due to engineering constraints but a clear improvement over previous versions. No interactivity in the first release but added to requirements for next release.